Accounts Receivable Dashboard
An Excel dashboard for tracking what customers owe, built on a real data model with VBA-generated reports. My PwC audit days picked the numbers it watches.
- Role
- Developer
- Date
- Aug 1, 2023
- Primary
- Excel
- Excel
- VBA
- Data Modeling
The problem
Businesses need to keep an eye on what their customers owe them, because accounts receivable health follows cash flow directly. Scattered formulas across sheets make that hard, since aging and outstanding balances drift out of sync as data changes. I had reviewed accounts receivable professionally during my PwC audit days, so I knew which numbers matter, how aging buckets should behave, and where the usual data mistakes hide.
What I built
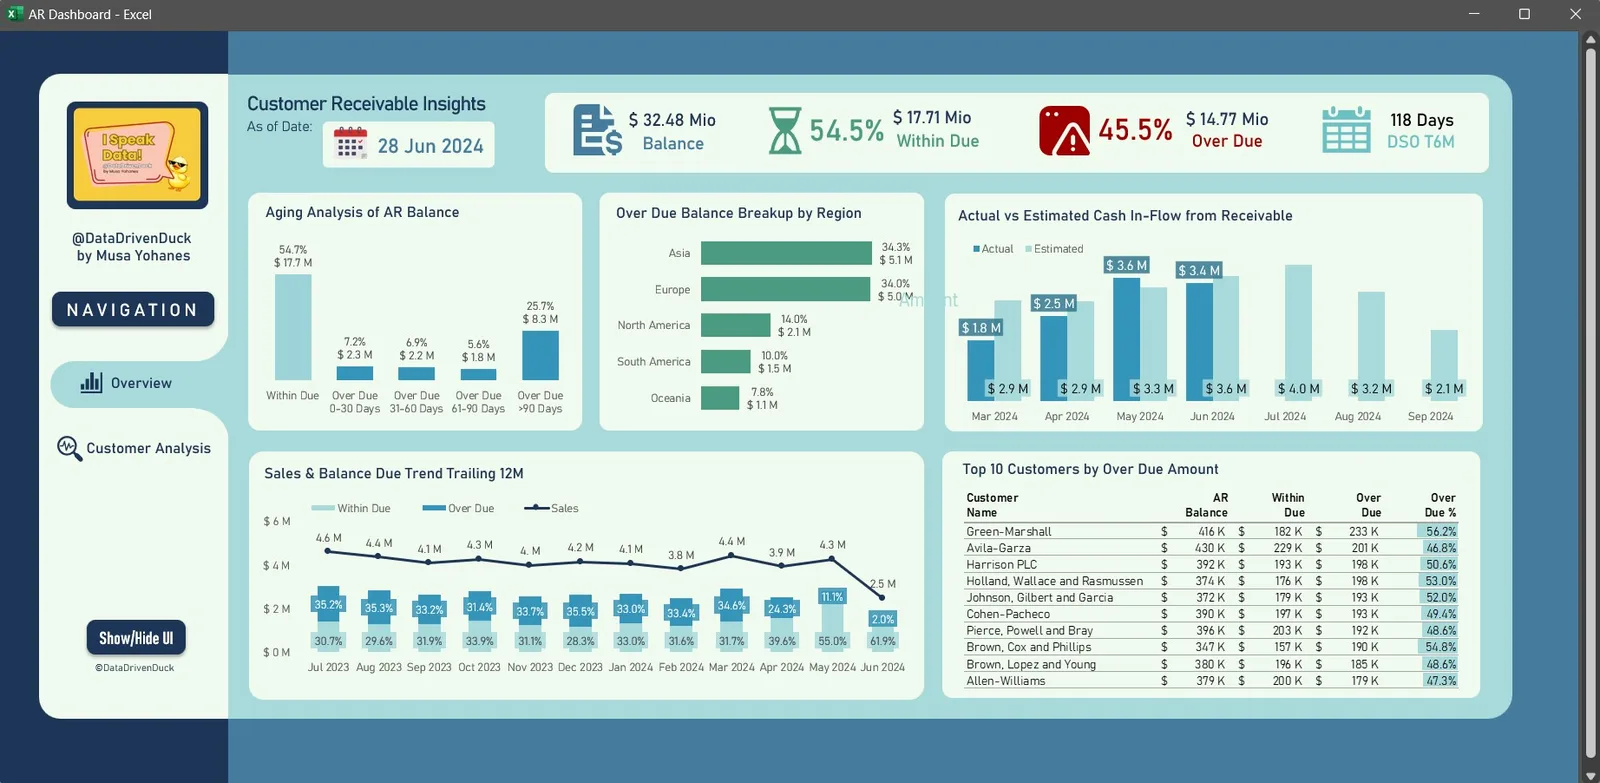
An Excel dashboard that sits on a real data model, where invoices, customers, and payments are structured properly, so metrics stay correct as the data changes. It has two pages, an overview and a per-customer detail view, connected through navigation buttons. The dashboard tracks aging in four buckets (0-30, 31-60, 61-90, and over 90 days), overdue categories, and credit limit usage. VBA hides Excel’s own interface so the sheet reads as a dashboard instead of a grid.
How it works
A dynamic as-of-date acts as the base for every metric calculation, and users change it through a date picker built with VBA. All charts and key figures update against that date, so the whole dashboard stays consistent with a single choice.
VBA handles the automation side: generating the reports and driving the interactive layer.
Excel formulas and pivot tables drive the calculation layer on top of the data model, so the numbers stay live when new data comes in.